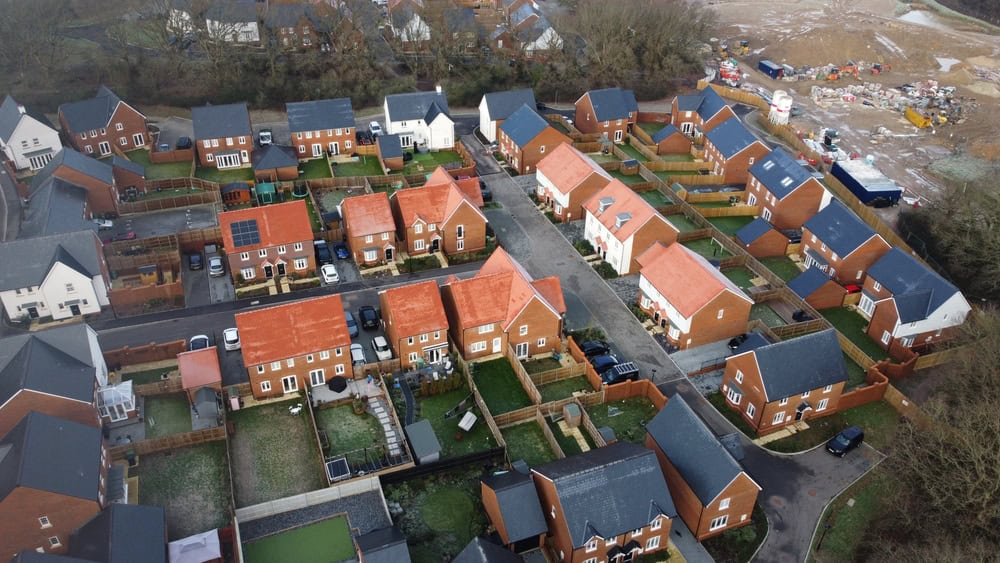
Supply shortage in Hertfordshire attracts highest prices
The hunt for new-build properties that offer more space and better value for money is increasingly pushing homeowners out of London and into the commuter belt, according to the latest research by UK Property Development.
It shows that demand for new-build homes in London is low, with the proportion of properties already sold subject to contract compared to total new-build stock standing at only 8.8%.
By contrast, demand in commuter counties is more than three times that in some areas. In Essex, 27.6% of new-build homes have already been sold subject to contract, followed by Hertfordshire at 23.7%.
Surrey ranks third at 21.2% and Kent is next in line at 18.3%. Buckinghamshire has demand of 17.5% and Berkshire 17.4%.
New-build shortages push prices up in Hertfordshire
Despite Hertfordshire’s second-place position, supply of new-builds is short in the county, accounting for 7.1% of all property listings. This is the lowest level of new-build stock within the commuter belt locations analysed and the same proportion recorded in London.
The supply/demand imbalance is pushing up prices in Hertfordshire more than in all London’s surrounding counties analysed, with the average price of a new-build home in Hertfordshire increasing by 3.5% over the last year, from £592,163 in March 2025 to £612,781 in March 2026.
Kent has also seen new-build prices increase, up by 2.5% on the year, while in Essex they have grown by 2.1%.
New-build prices drop in London
In London, however, average new-build prices have dropped by -1.5%, from £512,376 in March 2025 to £504,870 in March 2026. Over the past decade, Berkshire is the only surrounding county to see its average new-build price drop over the past decade, down by -0.4%
Andy Morrison, director of UK Property Development, said: “The contrast between London and its commuter belt is becoming increasingly apparent. While demand for new-build homes within the capital remains relatively subdued, buyers are showing a much stronger appetite for locations that offer greater value for money and more living space.
“Hertfordshire is a perfect example of this trend. Demand is among the strongest of any commuter county, yet new-build supply remains extremely limited. When buyer appetite significantly outpaces the availability of homes, upward pressure on prices is almost inevitable.
“The fact that new-build values are rising strongly across counties such as Hertfordshire and Essex, while falling in London, demonstrates where buyer priorities currently lie. Developers and local authorities will need to ensure sufficient housing delivery in these high-demand commuter markets if they are to prevent affordability pressures from intensifying further.”