
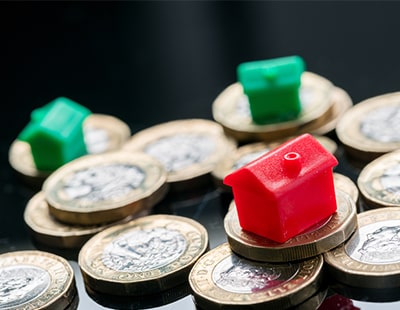
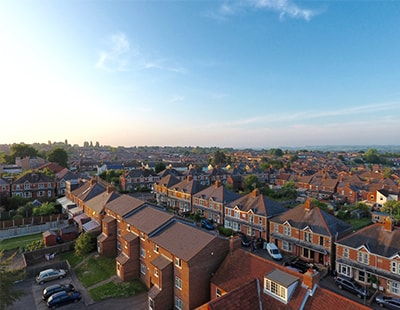
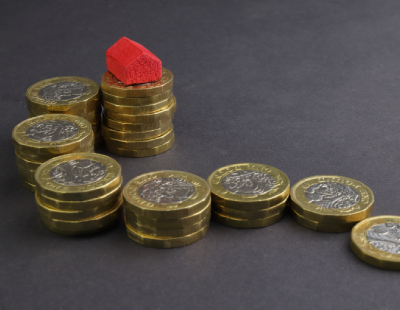
The number of homes sold in London was lower than any other part of England and Wales last year, according to Knight Frank’s recent analysis of Land Registry sales data.
Overall, the agency says that just 3.2% of all private London residential properties were sold in 2017, which was below the average of 4.1% for England and Wales.
The average for England and Wales was down from 4.3% in 2016, while London saw a decline from 3.6% the previous year. This figure suggests that affordability remains a key restriction on the property market and could explain fewer sales transitions as plans are delayed or more people are deciding to rent.
What’s more, liquidity in the London market equalled or exceeded the England and Wales average between 2001 and 2014 but has been comparably lower since then.
“Average prices in London were 59% above the pre-financial crisis peak in February 2018, which compares to 18% in the West Midlands and -6.5% in north-east England,” said Tom Bill, head of London residential research at Knight Frank.
He said that relatively high house prices in the capital are a contributory factor to the slower rate of sales.
Wales saw the highest property market liquidity, with 4.8% of all properties transacted last year. Other areas included south east England (4.2%), north west England (4.2%), south west England (4.4%) and the West Midlands (4.1%).
Further analysis compared market liquidity in London boroughs in 2017 to the long-run average since 2001, revealing that higher rates of stamp duty has acted as an additional drag on activity.
No boroughs saw liquidity levels in 2017 exceed their 17-year average, however, some of the largest declines were recorded in boroughs that typically contained high-value properties. The rate of Right-to-Buy purchases also influenced the figures.
Of the London boroughs; Camden, Hammersmith & Fulham, Islington Kensington & Chelsea, Lambeth, Lewisham, Southwark, Tower Hamlets, Wandsworth and Westminster recorded the largest declines in 2017 compared to the long-run average.
Meanwhile, Havering was the most resilient borough, which was only 0.3 percentage points below its long-run average in 2017. The long-run average rate of liquidity for the whole of London was the widest gap of any region, which was 1.5 percentage points above the figure of 3.2% recorded in 2017.
The highest ratio recorded for London was 7.2% in 2002, while Southwark experienced the most liquid property market, peaking at 10.2% in 2001.
“Higher rates of stamp duty have clearly also played their part in curbing transactions in the capital,” Bill said. “Add a dose of political uncertainty into the mix and the result is a residential property market that is being kept in check to some extent, despite low interest rates and high levels of employment.”


.png)

.jpg)


Join the conversation
Be the first to comment (please use the comment box below)
Please login to comment