
Residential property prices in key UK cities have proved resilient in the first half of the year, with growth of 5.1%, the latest Hometrack index figures show.
The increase takes the average price in the 20 cities covered by the index to £252,400 but there is some regional variation and some locations have seen a considerable slowdown, such as London where growth has dropped from 10.1% to 2.6% in the last 12 months.
No fewer than 13 of the 20 cities analysed have a lower annual growth rate than a year ago, but it is the capital which has registered the most dramatic slowdown year-on-year due to affordability pressures and the impact of political uncertainty on buyer sentiment. Despite this, Hometrack says that the rate of the slowdown is starting to flatten out and average prices in London were up 1.7% in Q2 2017.
Aside from London, other cities, including Bristol, Oxford and Cambridge, have also seen a marked slowdown in the rate of house price growth – down by between 6% and 10% over the past 12 months.
In Oxford and Cambridge house price growth, at 2.1% and 1.9 % respectively, is below the rate of general inflation of 2.6% as measured by CPI, and this means house prices are falling in real terms for the first time since March 2012.
In contrast, seven cities have a higher rate of house price inflation, led by gains in Birmingham, where prices are up 7.8% year-on-year, while some large regional cities, including Manchester, continue to register consistent and robust house price growth of over 6%.
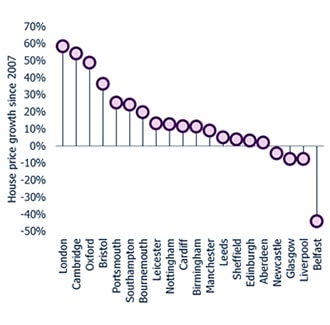
But many of these large regional cities still have a long way to catch up with long-term growth in places such as London, Cambridge and Bristol, where prices have increased between 40% and 60% since 2007.
Richard Donnell, research and insight director at Hometrack, commented: “Despite a material slowdown in the rate of house price growth in south eastern England, the headline rate of city house price inflation is holding up, despite the squeeze on real incomes and uncertainty around Brexit.
“The Brexit impact was greatest over the second half of 2016 but house price growth has picked up over the last six months. This is consistent with an 11% increase in the number of home purchase mortgages, which is also 5% higher than the five year average.
“In London, the Brexit vote has had a greater impact on buyer sentiment and combined with affordability issues has led to a 10% reduction in the annual growth rate over the last 12 months. However, although house price inflation has fallen sharply in the capital it is starting to flatten out and the rate of growth is likely to avoid year on year price falls in the coming months.”
Figure 1: City level summary, June 2017
|
City
|
Average price
|
%yoy
June 2017
|
% growth 2017H1
|
|
Aberdeen
|
£184,300
|
-2.7%
|
0.2%
|
|
Belfast
|
£130,600
|
4.3%
|
4.0%
|
|
Birmingham
|
£154,900
|
7.8%
|
6.1%
|
|
Bournemouth
|
£280,400
|
5.2%
|
3.1%
|
|
Bristol
|
£270,900
|
5.6%
|
4.6%
|
|
Cambridge
|
£425,500
|
1.9%
|
1.9%
|
|
Cardiff
|
£195,800
|
4.0%
|
2.2%
|
|
Edinburgh
|
£211,100
|
6.5%
|
5.5%
|
|
Glasgow
|
£117,700
|
3.3%
|
4.1%
|
|
Leeds
|
£161,400
|
5.4%
|
4.8%
|
|
Leicester
|
£164,500
|
5.8%
|
3.1%
|
|
Liverpool
|
£118,300
|
4.8%
|
3.8%
|
|
London
|
£492,700
|
2.6%
|
2.9%
|
|
Manchester
|
£155,700
|
6.4%
|
4.7%
|
|
Newcastle
|
£126,600
|
2.4%
|
3.6%
|
|
Nottingham
|
£146,000
|
6.0%
|
4.6%
|
|
Oxford
|
£424,800
|
2.1%
|
1.2%
|
|
Portsmouth
|
£229,700
|
5.6%
|
3.6%
|
|
Sheffield
|
£133,700
|
4.7%
|
4.1%
|
|
Southampton
|
£228,100
|
5.7%
|
4.2%
|
|
20 city index
|
£252,400
|
5.1%
|
5.0%
|
|
UK
|
£211,300
|
4.6%
|
3.9%
|
Figure 2: Annual house price growth June ’17 v June ’16
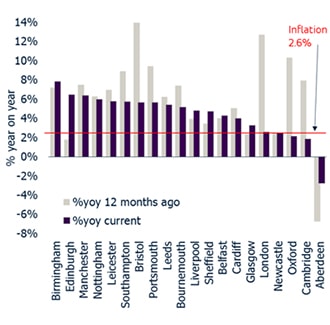
Figure 3: City house prices relative to their 2007 peak


.png)


Join the conversation
Jump to latest comment and add your reply
The prices are growing slower but are still growing... in London house prices are extremely high despite Brexit.
Please login to comment