
There has been a sharp slowdown in house price growth across all major cities in the south of England, but market activity levels and house prices in northern cities continue to surge, new figures show.
Hometrack, which monitors residential property prices in 20 UK cities, said that overall house price growth over the last three months slowed to 9.5% in July after 12 months of higher growth, fuelled largely by a rapid de-acceleration in prices in London and other high value cities across the south of England.
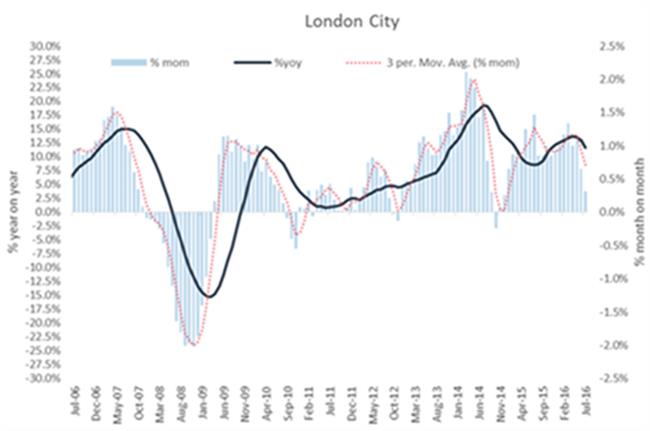
In the three months to July, property prices in London increased by just 2.1%, the lowest quarterly rate since February 2015, while Bristol, which is the fastest growing city over the last 12 months, saw growth over the last three months slow to 2.6% from a recent high of 5% in May 2016.
“In the absence of adverse economic trends impacting employment and mortgage rates, the near term outlook is for a continued slowdown in London towards mid-single digit growth,” said Richard Donnell (below), insight director at Hometrack.
He continued: “The slowdown in London is being seen across the market is not accounted for by seasonal factors with weaker demand from home owners and investors as supply grows. This analysis suggests London house price growth will continue to slow over the rest of the year.”
In the last quarter, the highest rates of growth have been registered in lower value, high yielding cities, including places like Glasgow, Liverpool, Manchester and Nottingham.
“Northern regional cities will continue to register stable growth rates as households’ benefit from record low mortgages rates and affordability remains attractive,” Donnell added.
Aberdeen remains by far the worst performing housing market, but the annual rate of growth fell at a slower rate of -8.0% in July with prices up 2% in the last quarter, which suggests that the housing market may have adjusted to the impact of falling oil prices on demand over the last 12 months.
Donnell concluded: “We continue to believe that turnover will register the brunt of the slowdown in London. In the face of lower sales volumes agents will look to re-price stock in line with what buyers are prepared, and can afford to pay. Past experience shows that this process can run for as long as six months and relies, in part, in how quickly sellers are willing to adjust to what buyers are prepared to pay.”
|
City
|
Average price
|
% yoy July 2016
|
% last quarter to July 2016
|
|
Glasgow
|
£115,200
|
5.3%
|
5.2%
|
|
Oxford
|
£416,000
|
10.1%
|
4.7%
|
|
Liverpool
|
£113,400
|
7.7%
|
4.4%
|
|
Nottingham
|
£137,900
|
7.4%
|
3.4%
|
|
Manchester
|
£147,700
|
8.4%
|
3.4%
|
|
Edinburgh
|
£203,600
|
2.7%
|
3.1%
|
|
Leicester
|
£152,700
|
7.4%
|
3.0%
|
|
Newcastle
|
£127,400
|
4.2%
|
2.8%
|
|
Sheffield
|
£129,600
|
4.1%
|
2.8%
|
|
Bristol
|
£254,500
|
14.0%
|
2.6%
|
|
Portsmouth
|
£216,200
|
8.9%
|
2.2%
|
|
Birmingham
|
£143,300
|
7.6%
|
2.1%
|
|
London
|
£476,600
|
11.7%
|
2.1%
|
|
Aberdeen
|
£184,600
|
-8.0%
|
2.1%
|
|
Leeds
|
£151,500
|
7.3%
|
2.1%
|
|
Cardiff
|
£189,200
|
7.1%
|
1.7%
|
|
Southampton
|
£213,300
|
8.3%
|
1.7%
|
|
Bournemouth
|
£262,600
|
6.6%
|
0.6%
|
|
Belfast
|
£122,700
|
2.8%
|
0.1%
|
|
Cambridge
|
£404,500
|
7.1%
|
-1.0%
|
|
20 city index
|
£240,000
|
9.5%
|
3.2%
|
|
UK
|
£202,400
|
8.1%
|
2.6%
|


.png)


Join the conversation
Be the first to comment (please use the comment box below)
Please login to comment